NaviGateAI develops and field-validates an interoperable real-time decision support platform that strengthens situational awareness in emergency response. The project delivers a TRL 7 MVP that fuses drone video, wearable and helmet sensors, thermal and visual streams, IMU, and a priori building and geospatial data into a continuously updated 3D operational picture with prioritized, explainable recommendations for incident command, supporting fast “how”, “why”, and “what-if” queries.
Complex urban simulations are often difficult to discuss collectively. Results live on individual screens, in reports, or PowerPoint presentations, making shared immersive interpretation challenging.
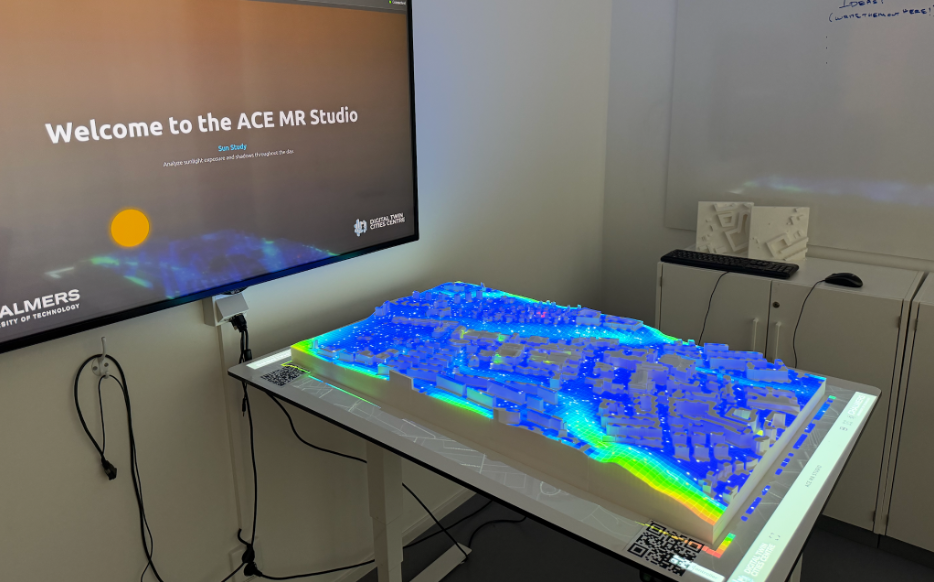
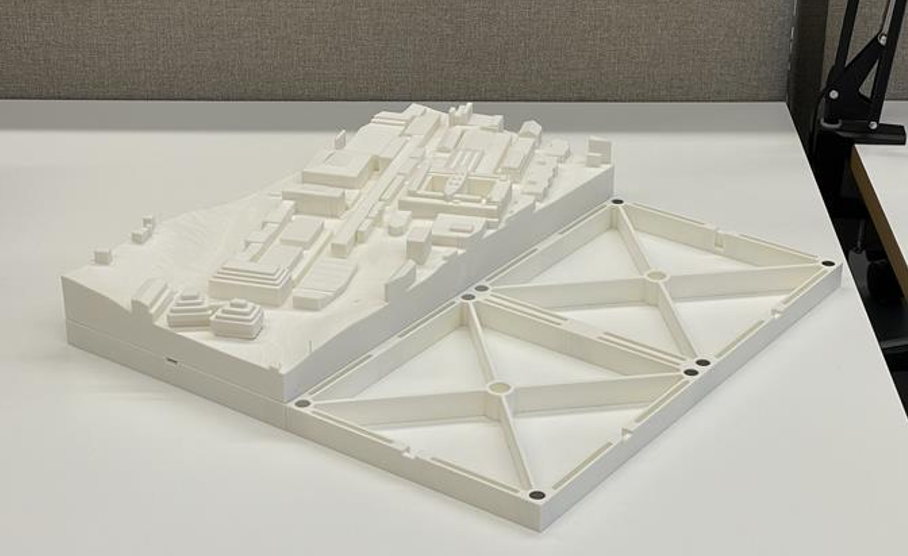
The Research Area Sustainable Built Environments (SBE) at Chalmers developed the ACE Mixed Reality Studio to address this problem. The studio combines a physical model of the Chalmers Campus with Mixed Reality visualisation workflows to develop, test and support collaborative analysis and decision-making.
The Vision: Making the Invisible Visible
In sustainable urban research, we often simulate futures that nobody in the room can quite see. We face a “black box” problem: sophisticated simulations yield important data, but when results live only in spreadsheets, dashboards, or PowerPoint slides, stakeholders struggle to engage. Too often, the most critical insights never make it into the room where decisions are actually made.
In 2020, Associate Professor Alexander Hollberg (PI) began articulating the need for something more specific than a new visualisation technique. Table-based models and immersive environments were not new. What was missing was a dedicated space at Chalmers: a lab where digital urban methods could be tested, demonstrated, and developed collaboratively, rather than remaining as isolated prototypes or one-off demonstrations.
Before we committed to a physical model, we explored the digital bits. Through the DTCC Twinable project, with Liane Thuvander, we tested the waters in Virtual Reality.
Early explorations in the Twinable project: Procedural VR environments from real-world data.
While technically impressive, these VR experiences revealed a persistent tension: the more immersive the headset became, the more socially distant the room felt. Stakeholders were cut off from non-verbal cues and tactile interaction, making collective decision-making difficult.
In search of a shared medium, we collaborated with Universeum Vislab and Jonas Boström to visualise our research data on their exhibition table. This was a revelation. Seeing our data narrative unfold on a physical map demonstrated the immense power of storytelling in communicating complex urban issues. It allowed stakeholders to stand together, point out, and discuss issues.
The Universium vislab Urban Model of Gothenburg
However, relying on an external exhibition model limited our ability to iterate. We couldn’t just print a new district or change the code overnight. We realised that to truly prototype new solutions, we needed this infrastructure in-house. With advice from Infravis and Linköping University, who helped develop the Universeum model, we began planning our own solution.
Why a Table?
Why, in an age of AI and immersive headsets, do we return to a physical table?
Because complex urban decisions are rarely made by one person, they are social processes. A table is inherently democratic; it allows multiple people to view the same data from different angles simultaneously. It grounds abstract metrics in a physical reality that everyone in the room can agree on – A boundary object. When you project a heat map onto a physical model, it stops being a chart and becomes a place.
The Material as a Character
The goal was clear: build a physical platform that could host digital data. We started by consulting the experts at our own A-verkstad. Jarkko Nordlund and Tabita Nilsson gave us the confidence that we could manufacture the model in-house.
Choosing the material was not a trivial decision. Whatever we printed would become both a research instrument and a projection surface. It needed to be precise, neutral, robust, and reproducible.
AddNorth EPLA Economy turned out to be an ideal solution. Beyond being 100% corn-based and Swedish-made, its matte white finish acts as a perfect canvas for projection mapping. It reflects light neutrally without the specular highlights you might get from PETG or ABS, effectively becoming a physical screen.
In practice, this meant we could treat the physical model not as a fragile artefact, but as an everyday research instrument: handled, reconfigured, and reused without much hassle.
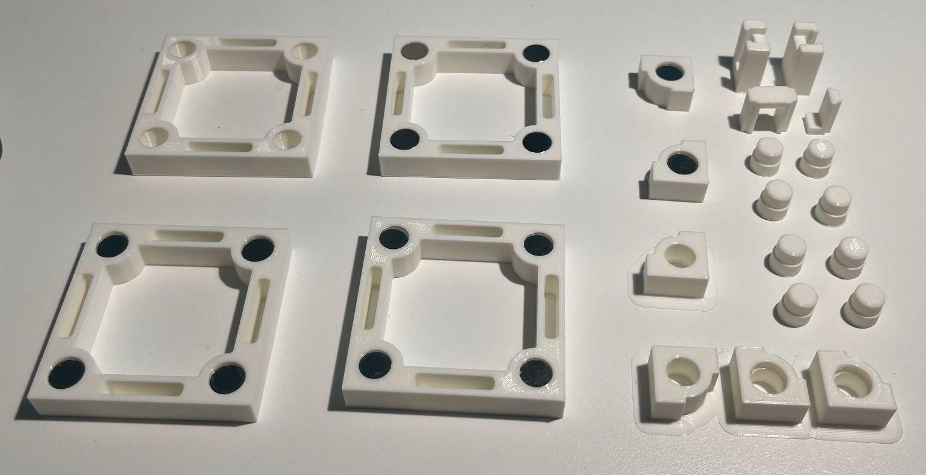
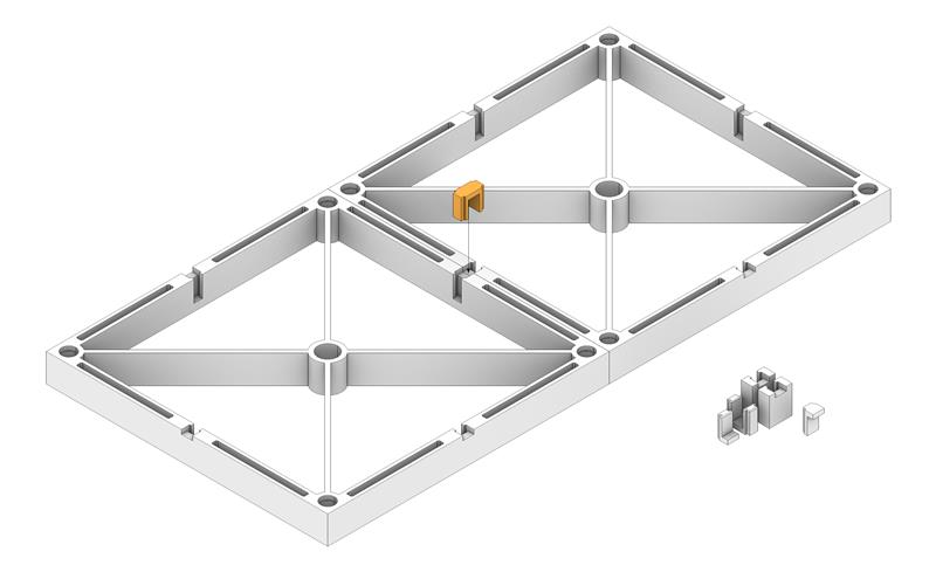
Close-up of the 3D printed tiles showing the reinforcement ribs and magnet positions.
Aiming for Modularity
Building the physical model wasn’t just about printing; it was a design challenge led by Sanjay Somanath. “We didn’t want a static sculpture; we wanted a system that could grow with the campus.” says Sanjay.
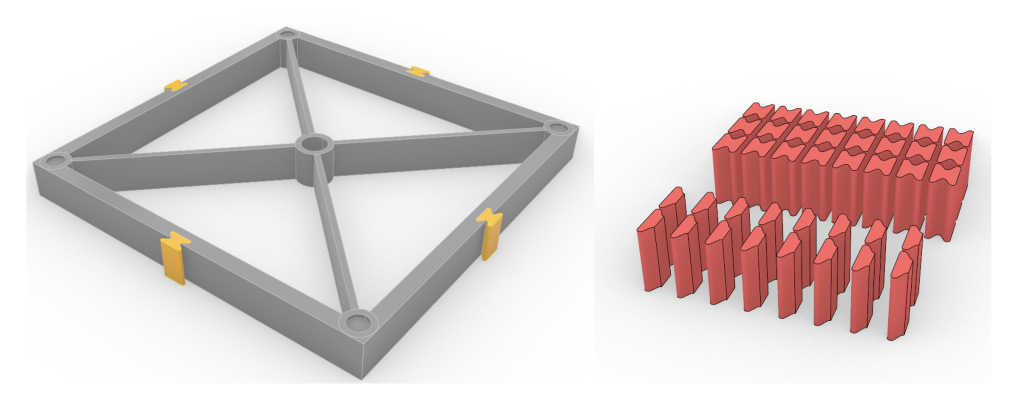
Early CAD models of the MR Table showing the tiling system and the detailed buildings.
Sara Abouebeid provided a detailed base model of the Chalmers Campus, which included landmark buildings such as the Johanneberg Science Park, the climbing hall, and the Chalmers ACE building. The next step was to design a scalable tiling system. Our initial designs used a dovetail locking mechanism.
In late 2025, Master’s student Arvid Hall joined the team as a student assistant and identified a critical flaw: the dovetails required vertical insertion. To replace a single central tile, you had to dismantle the entire surrounding neighbourhood. Arvid prototyped a wide range of alternatives, experimenting with rods, buttons, and various radii, before settling on a robust slotting tab system.
This seemingly small change, from dovetails to lateral slots, meant that the model could behave like a living system rather than an artefact. It allowed us to swap out a “2025” building tile for a “2030” proposal in seconds, without disrupting the rest of the neighbourhood.
The advantage of this code-driven approach is its universality. We can generate a physical-digital twin for any location in Sweden, from a single city block to an entire municipality, almost entirely automatically.
PowerPoint as a Projection Engine
While the printer nozzles were busy, the digital team was solving the other half of the puzzle: the projection.
Vasilis Nasarentin (DTCC) and Fabio Latino (Infravis) supported the development of the pipeline. Aiming for a “Minimum Viable Product,” our first projection system was… PowerPoint!
It allowed us to prove the concept and test the readability of text, colour reproduction and animations at 1:1250 scale without writing a line of code. Once validated, we moved to a full-fledged web app.
Real-time 2D Lattice Boltzmann CFD simulation projected onto the table.
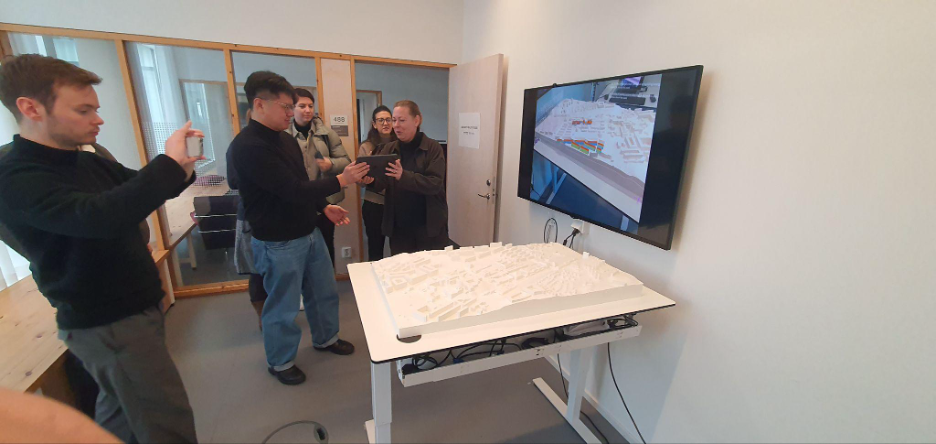
Simultaneously, PhD student Jieming Yan is developing Augmented Reality (AR) prototypes to layer building performance data directly onto the physical model. You first see the physical context, but holding up a tablet reveals the invisible energy metrics.
Technical details
The Software Stack
We deliberately moved away from heavy game engines like Unity or Unreal Engine at this initial stage to ensure accessibility and rapid prototyping:
MapLibre GL JS: Handles core map rendering and vector tiles.
Three.js: Handles the real-time shadows.
GeoTIFF.js: Enables client-side processing of heavy DEM rasters for stormwater simulations.
BroadcastChannel API: Decouples the interface, allowing a presenter to drive the visualisation from a tablet while walking around the table.
The Calibration Challenge
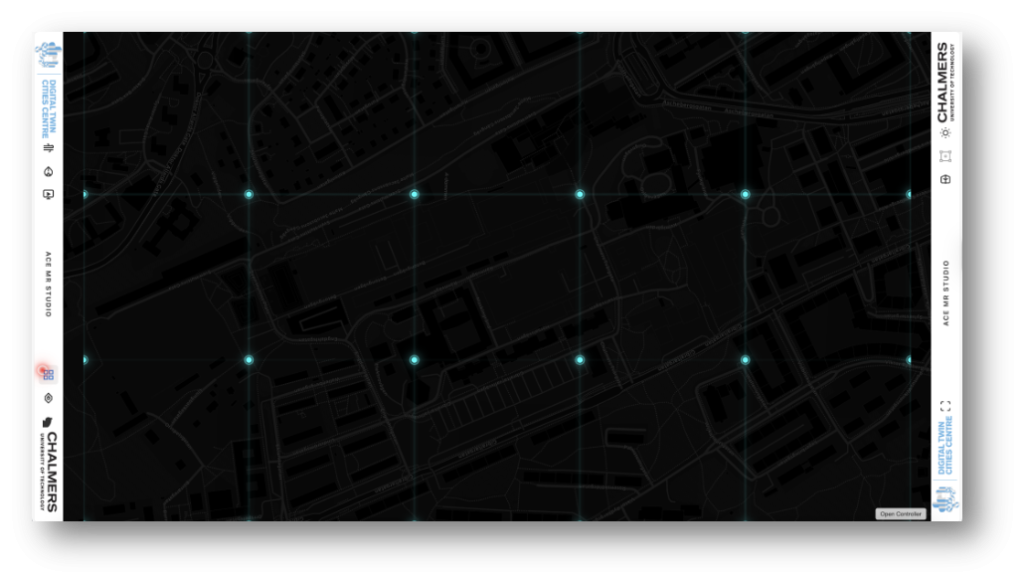
We avoided expensive mesh-warping software by leveraging the web stack. We built a “Grid Animation” layer: a projection of the physical tile boundaries. We manually adjust the digital camera in the web app until the hologram overlaps the physical seams, saving the configuration to a JSON file.
The Data Pipeline
The pipeline is built on the open-source DTCC Platform.
Automated Tiling: We utilise Blender in headless mode to automatically slice the large city mesh into standard 20cm × 20cm tiles.
Magnet Integration: We learned a hard lesson during prototyping: standard N52 neodymium magnets were too strong and often ripped out of their housings. We switched to slightly weaker magnets, which provided the perfect balance of holding force and durability.
AR Tracking
Tracking on a featureless white surface is difficult. To simplify this problem, Jieming Yan used Fologram and Rhino Grasshopper. Pre-simulated results are stored locally, and the visualisation is synchronised to a handheld device through a Grasshopper–Fologram workflow. Once data loading and occlusion challenges are addressed, QR-based reference markers are used to align the virtual and physical models. “Once scaled and aligned, the digital model remains spatially registered with the physical one, allowing building-performance data to be explored in its physical context.” says Jieming Yan.
A Canvas for Discussion
A table needs a home. Henriette Söderberg, Angela Sasic Kalagadis, and Elisabeth Meyer helped us transform “SB-488”, a standard meeting room, into a dedicated studio with controlled lighting and ceiling-mounted projection.
The true test of the studio is in its use. As Ida Gäskeby (Chalmers Fastigheter) noted during our testing:
“This is a very different type of thing than just watching a PowerPoint… with this table we can show information at different levels of knowledge… and discuss important decisions.”
An Invitation
We are just getting started. The ACE Mixed Reality Studio is not a finished system, but a shared platform for experimentation.
If your research produces maps that are hard to explain, simulations that stay stuck on laptops, or results that disappear into reports, this table is for you.
We are looking for partners to push the boundaries of this platform. If you have urban data and ideas for visualisation, come visit us for a demo!
This week we sat down with Alexander Hollberg, the Research Area Leader for Sustainable Built Environments, to discuss his current projects, research achievements, and insights for early-career researchers. From leading projects in the Computational Design theme, Alexander shares his thoughts on how digital methods are shaping the future of sustainable architecture and urban planning.
Could you tell us about the different projects you are currently leading or involved in within Sustainable Built Environments?
I lead several projects in the Computational Design theme of our research area. Overall, we are interested in how digital methods can support design and decision-making for a sustainable built environment. Different projects look at different approaches to answering this question, ranging from augmented and virtual reality to multi-domain simulations using digital twins. I am also acting as research area leader.
Looking back, what are some key achievements or milestones from your research that you’re most proud of?
That is a difficult question. I am still proud of my PhD thesis that I thought nobody would ever read but that seemed to have inspired others to use LCA for building optimization in early design stages. I am also proud of our collaboration with Universeum, where we provide different data visualizations—not because of the research itself, but because it attracts lots of interest from citizens visiting the exposition.
How do your projects contribute to addressing global challenges in sustainability and the built environment?
Our projects mainly focus on environmental aspects by aiming to lower resource consumption and environmental impacts from the construction and operation of buildings. We also have a few projects that take social and economic aspects into account.
What advice do you have for early-career researchers looking to make a meaningful impact in this field?
Follow your interests, be creative in how you address challenges, be open to criticism, and share your research results with the world.
When you’re not working on research, how do you like to spend your time or unwind?
Work and my kids already occupy 26 hours a day, but if I have the chance, I go for a run in Ängårdsbergen. I always feel refreshed and more creative afterward. I also like bouldering and, in the summer, wingfoiling because I can completely detach from work.
We thank Alexander for sharing his insights and experiences with us. His contributions to sustainable design and computational methods continue to inspire researchers and practitioners alike. We look forward to following his ongoing and future projects!
This week, we sat down with Sara Abouebeid and David Sindelar, two of our project assistants in the Sustainable Built Environments research group, to learn more about their work, research experiences, and perspectives on sustainability. From energy resilience to material stock mapping, Sara and David share their insights on the projects they are contributing to and what excites them about their research.
Sara
What inspired you to join the Sustainable Built Environments research group at Chalmers University?
I have been following the work of the SBE group for some time and have always been interested in their research. Before joining, I worked across different scales and domains, which helped me develop a broad perspective on sustainability. When the opportunity to join SBE arose, it felt like a natural next step in my journey.
Could you tell us about the projects you are currently working on and their potential impact?
I am involved in two projects: Digital Twin for Positive Energy Districts (DT4PED) and Energy Communities for the Future (ECOM4Future). These projects explore ways to enhance energy resilience and decentralise energy systems in existing districts through a multi-disciplinary approach. We aim to optimise the energy performance of existing buildings, develop strategies for energy flexibility, and maximise local renewable energy generation.
How has this experience shaped your skills, and what are you hoping to develop further?
I previously worked on energy modelling at the building scale, but these projects have given me the opportunity to expand my focus to the district level. Working alongside electrical engineers, mathematicians, cloud architects, and developers has helped me integrate new methodologies into my models. Moving forward, I would like to strengthen my project management skills to contribute more effectively to research coordination.
What excites you most about the DT4PED project?
DT4PED is particularly exciting because it serves as a blueprint for sustainable energy transitions in Sweden. It’s rooted in a real-world case with engaged stakeholders, and I can see how my research contributes to tangible change. I’m also looking forward to publishing three research papers based on our recent findings.
When you’re not working on research, how do you like to spend your time?
Lately, I’ve taken up badminton and try to play once or twice a week—it’s great to have colleagues who share the same interest! On quieter days, I enjoy punch needling, especially when it’s grey outside. I also love hiking with my dog, Pucci, and I’m actively involved in Amplify Voices, a non-profit organisation that supports women from foreign backgrounds in Sweden by providing a platform to share their stories and experiences.
David
What drew you to the Sustainable Built Environments research group at Chalmers University?
With a background in architecture and adaptive reuse, I wanted to explore sustainability in greater depth and see how it can be applied to contemporary building practices. Joining the SBE research group has given me the opportunity to contribute to this field in a meaningful way.
Could you describe the project you are currently working on and its significance?
I am working on developing non-residential building archetypes to map the material stock in Gothenburg’s built environment. This research is part of a broader project aimed at establishing a tool for city planners to identify building materials as a second-hand resource, supporting more sustainable construction practices.
How has this role helped you grow, and what do you hope to gain from it?
This experience has challenged me to think more creatively when solving problems and has provided valuable insight into conducting research at a high level. I’ve gained a better understanding of how sustainability and resource efficiency can be integrated into urban planning.
What excites you most about sustainable design and infrastructure?
For me, the most exciting aspect is the transdisciplinary nature of sustainable design. It requires thinking beyond traditional boundaries to develop solutions that address multiple complex challenges simultaneously. This kind of collaboration is both stimulating and essential for creating impactful change.
What are some hobbies or activities you enjoy outside of research?
Outside of work, I am an avid badminton player and a keen bird watcher—mainly for the drama! I also enjoy spending time in the wood workshop, where I experiment with different projects (with varying degrees of success!).
We are delighted to have Sara and David as part of our team and look forward to seeing how their research contributes to the future of sustainable built environments. Stay tuned for more updates from our research group!